Problem set 3
Due by 11:59 PM on Saturday, September 21, 2019
Submit this as a PDF on iCollege. You can use whatever you want to make your drawings, including Gravit Designer, Adobe Illustrator, Excel, PowerPoint, Microsoft Paint, or photographed/scanned pen and paper.
Cite your sources and show your work.
1
Consider the society you live in, or another society with which you are familiar.
- To make society fairer (according to the substantive judgement of fairness), would you want greater equality of income, happiness, or freedom? Why? Would there be a trade-off between these aspects? (≈30 words)
- Are there other things that should be more equal to achieve greater substantive fairness in this society? (≈30 words)
- How fair is this society, according to the procedural judgement of fairness? (≈30 words)
- Suppose that, behind a Rawlsian veil of ignorance, you could choose to live in a society in which one (but only one) of the three procedural standards for fairness (voluntary exchange of property, equality of opportunity, and deservingness) would be the guiding principle for how institutions are organized. Which procedural standard would you choose, and why? (≈50 words)
2
Two farmers have unlimited access to a common plot of land and can let their cows graze on it. The matrix below shows the benefits they get from grazing either 1 or 2+ cows on the land.
Farmer 2 1 cow 2+ cows Farmer 1 1 cow 8, 8 2, 10 2+ cows 10, 2 4, 4 - What category of game is this?
- What is/are the Nash equilibrium/equilibria?
- What is/are the Pareto efficient outcome(s) in this game?
The government offers a reward or subsidy for communities where farmers only allow 1 cow to graze on the common field, resulting in this new payoff matrix:
Farmer 2 1 cow 2+ cows Farmer 1 1 cow 15, 15 2, 10 2+ cows 10, 2 4, 4 - What category of game is this?
- What is/are the Nash equilibrium/equilibria?
- What is/are the Pareto efficient outcome(s) in this game?
How is Pareto efficiency different from fairness? (≈30 words)
3
You’re in for some exciting times! You get to do some actual econometric analysis and measure the effect of a real world policy using a fundamental causal inference method: differences-in-differences (DiD). With DiD, you compare the difference between two groups (treatment and control) before and after an intervention took place. With this difference, you can actually tell a causal story about an intervention, rather than just talking about correlations.
Go to chapter 3 in CORE’s new Doing Economics book and walk through the empirical project there, measuring the effect of Berkeley’s 2014 sugar-sweetened beverage tax.
Download this file to get all the data you need. In CORE’s instructions it says to go to Berkely’s project-specific website to get the data, but you don’t need to—I’ve collected it all here in one Excel file:
CORE provides step-by-step instructions for how to do this all in Excel.If you’re feeling super adventurous, you can follow the instructions in R, but don’t worry about that.
Make sure you click on the + sign in the green “Excel Walk-Through” sections to see these instructions:
When questions ask about statistical significance, look in the original article for *, **, †, and ‡ signs (and look in the figure footnotes to see what ranges of p-values they indicate (like ‡ means \(p < 0.05\))). You don’t need to calculate the p-values on your own (and you can’t really in Excel anyway). If you haven’t taken stats yet, or you can’t remember what p-values mean, look at the super fast bullet-point crash course in statistical significance at the bottom of this page.
Importantly, CORE provides the answers for you (\(•◡•)/) so you can check your own findings. The important part of this assignment is figuring out the process for making PivotTables + understanding the intuition behind DiD as a method of analyzing the effectiveness of a policy.
It’ll be really tempting to copy/paste their answers into your assignment. Don’t do that—answer the questions in your own words.
Answer the questions below (these are in the Doing Economics chapter, but tend to get buried in the explanatory text). I’ve added some additional hints below, too.
The treatment group
- Do this. (But don’t just copy/paste the answer from CORE. It’ll be tempting, but don’t do it!)
- Make these frequency tables.
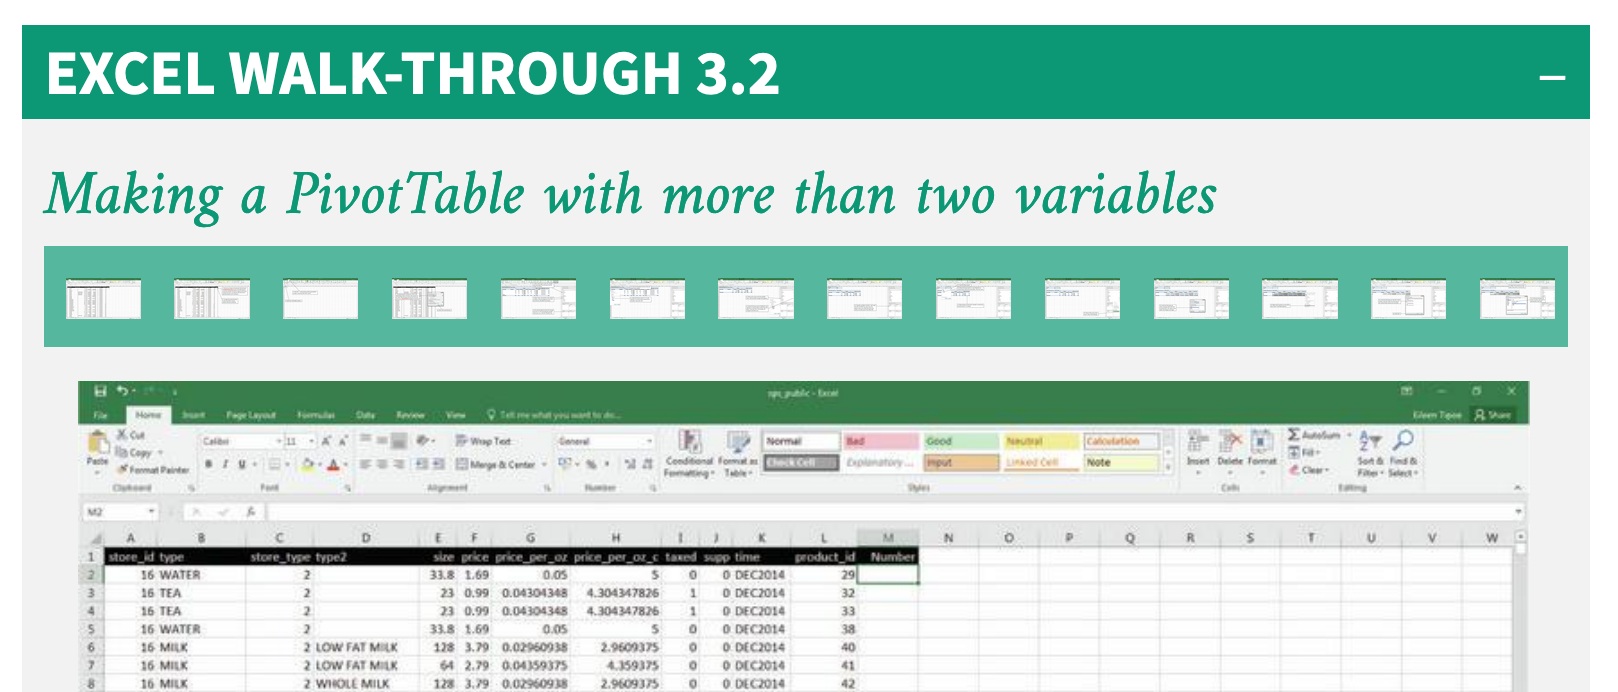
- Do this. The trickiest part here is filtering the data correctly. In the original paper, the authors included products that existed in a store across all three time periods. For instance, if one store dropped a product in 2016, the product for that store is not included—but it can be included for other stores if they still sold it in 2016. Use the
COUNTIFS()function in Excel (as shown in Doing Economics Excel Walk-Through 3.2; a value of 3 means the product was in the store for all 3 cycles; if it’s 2 or 1, it was missing in one or more cycles. You’ll have a formula that looks something like this:=COUNTIFS(A:A, A2, L:L, L2)). Also, remember to exclude supplementary drinks. - Calculate differences in average price per ounce and make the graph.
- Try to answer this, but you don’t need to calculate any of the p-values—look at the original paper for stars and confidence intervals. Low p-values (under 0.05, or 5%) indicate statistical significance.
The control group
- Do this. (Again, for this and all these others, don’t copy/paste the answer from CORE!)
- Make the table and plot.
- Answer this. Again, you don’t need to calculate any of the p-values here, but you do need to discuss what they mean.
- Answer this.
- Answer this.
- Speculate about this.
Statistical significance crash course
- If you measure something about two groups and calculate the average, you might see a difference between them. However, this difference could just be because of chance and not a real difference in real life.
- For instance, if you measured the heights of everyone in our class and then figured out the average height by gender, you might find that on average, men are 1.5 inches taller than women. But we can’t really be super confident that our one class represents the entire population, and maybe that difference is just because there are a couple really tall men in the class. We’re not 100% sure that there’s a real difference.
- To attempt to get a measure of certainty for differences, we can imagine a world where there’s actually no true difference in height between men and women. (This doesn’t mean that everyone would be the same height; it means that there would be a bunch of tall men, a bunch of tall women, a bunch of short men, a bunch of short women, a bunch of medium men, a bunch of medium women, and so on).
- Imagine that in this hypothetical world, you measured the heights of 100 random groups of people and calculated the differences in height by gender. Sometimes the difference is 1 inch. Sometimes it’s −2. Sometimes it’s 0.5 or −1.3 or 0.04. All those differences would be totally normal in a world where there’s no gender-based difference in height
- Moving back to the real world, where we found a 1.5 inch difference between men and women, we can conclude that such a difference isn’t all that abnormal or weird. If we lived in a world with no difference, a 1.5 inch difference would fit just fine. The probability of seeing a 1.5 inch difference would likely be pretty high, like a 70% chance maybe. Pretty common. We can conclude that there’s no statistically significant difference between the average heights of men and women in our class.
- If, however, we found that the difference in average heights was 12 inches, we’d have a different conclusion. In a hypothetical world where there’s no true difference, it’d be weird to accidentally stumble on a difference that big. The probability of seeing a 12 inch difference is really low—maybe something like a 1% chance. If we saw a 12-inch difference in real life, we could call that statistically significant and have some confidence that the difference is real and not due to chance.
- P-values measure the probability of seeing a difference at least as large as what is reported in a world where there’s no difference. If a p-value is high, it means seeing such a number would be common and thus is not significant; if a p-value is small, it means that seeing such a number in a world of no difference (or no effect) would be rare, and thus it is significant.
- In general, the threshold for statistical significance is 5%. If there’s less than a 5% chance of seeing a value in a world where there’s no effect, we can call that significant. If there’s more than a 5% chance, we don’t worry about the difference.
- So, if you see that there’s a 1 ¢/oz increase in the price of sodas in large supermarkets, and you see that there’s a ‡ sign (which, according to the footnote, means that \(p < 0.05\)), it means that the chance of seeing a 1¢ difference in a world where there’s actually no difference is pretty low, which means there’s a statistically significant, measurable difference (or effect).