Capitalism
Materials for class on Thursday, August 29, 2019
Contents
Slides
Download the slides from today’s class.

Pit market results
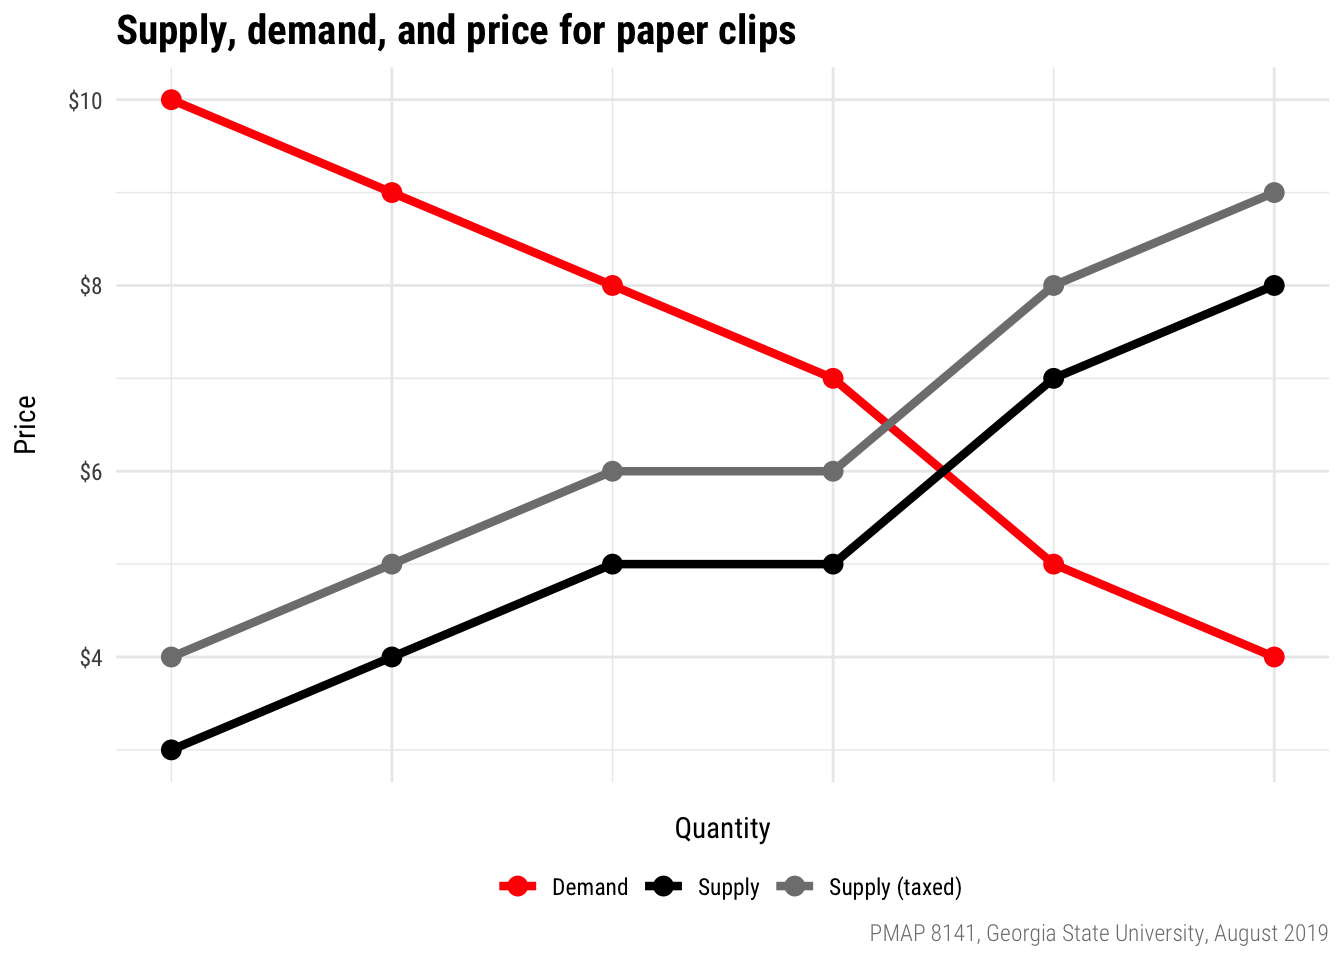
Here are the supply and demand curves for paper clips. With no taxation, the equilibrium price should be $6; with tax, it is $6.50, borne equally by buyers and sellers.
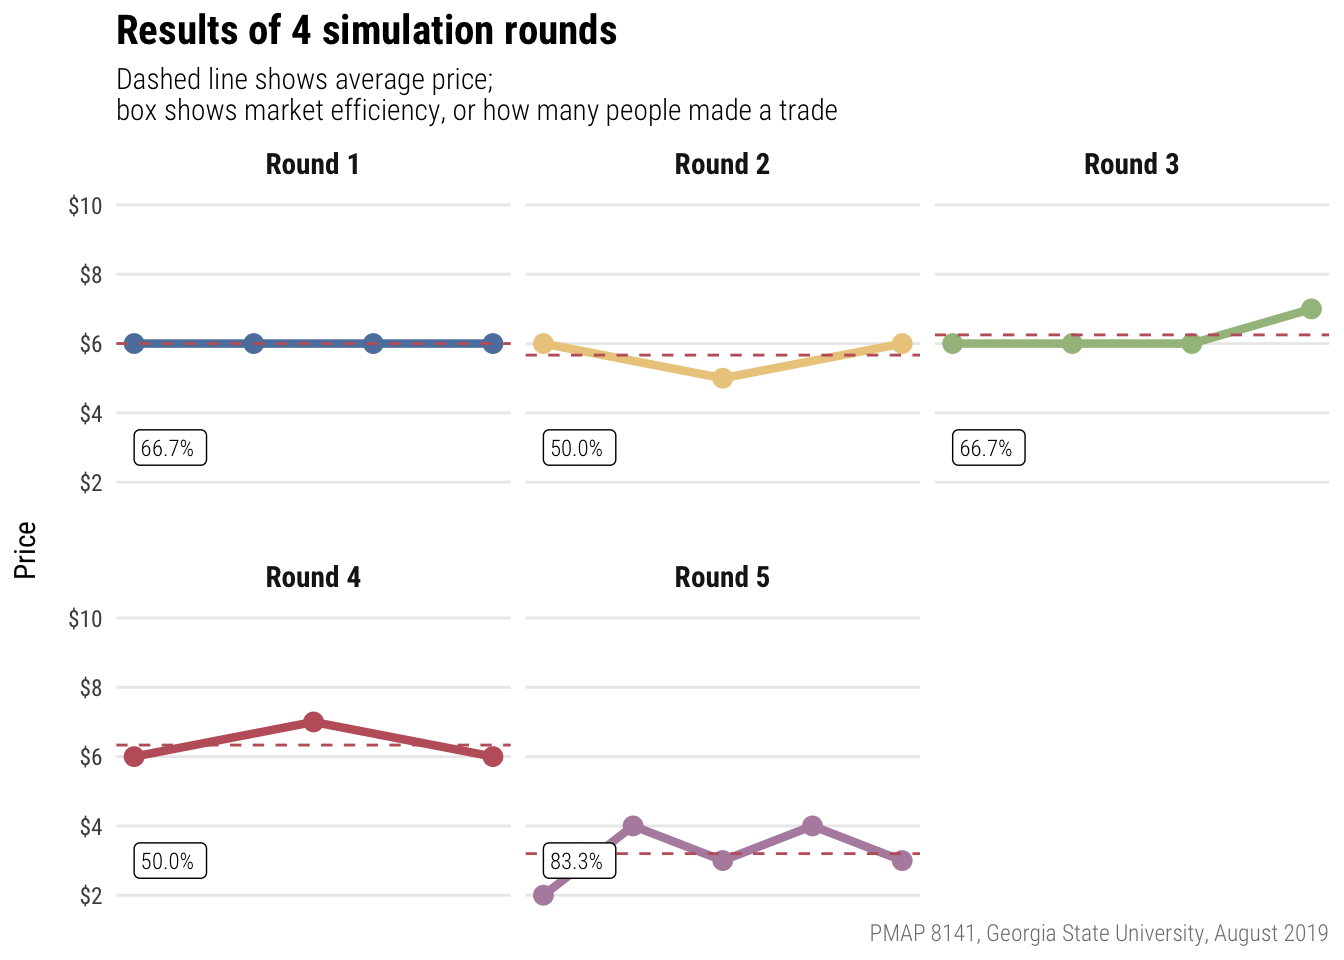
And here’s how you did!
Economic indicators
- GDP (nominal)
- GDP deflator
- CPI
- Personal income (nominal)
- Population
- Personal income per capita (nominal)
- Health expenditures per capita (nominal)
Fun with math and Excel
Here’s what we’ll do:
- Convert nominal values to real values
- Rescale the CPI to a different year
- Calculate inflation rate
- Calculate average inflation over time
- Compounding inflation
Download this file:
Also, according to the US Census, the median home price in 1990 was $125,000. In 2018, it was $329,600.
- What was the nominal percent change in housing prices?
- What was the real percent change in housing prices?
- What was the average yearly rate of change in housing prices?
Nominal to real
Converting nominal values (the numbers written down at the time) to real values (the numbers in today’s / another year’s dollars):
\[ \text{Real value} = \frac{\text{Nominal value}}{\text{Price index / 100}} \]
Shifting CPI
Shifting the price index to a different year:
\[ \text{Price index}_{\text{new year}} = \frac{\text{Price index}_{\text{current year}}}{\text{Price index}_{\text{new year}}} \times 100 \]
Inflation rate

The inflation rate is the percent change in CPI between two periods. The formula for percent change is fairly simple—just remember NOO!
\[ \text{% change} = \frac{\text{New} - \text{Old}}{\text{Old}} \]
or
\[ \text{% change} = \frac{\text{Current} - \text{Previous}}{\text{Previous}} \]
Pay attention to the time periods in data from FRED.Or anywhere, really.
Datasets like GDP are reported quarterly, while the CPI is monthly. If you need to calculate the annual change (or annual inflation), make sure you either (1) use the same month or quarter as your current and previous times (i.e. January 2016 and January 2017), or (2) add all the percent changes within the year (i.e. add the rates from January 2016, April 2016, July 2017, and October 2017).
Compounding inflation
The compound average inflation rate is the percent that if the CPI had grown at that rate, compounded, from the start year to the end year, the same CPI would occur in the end year. To calculate this, use the formula for compounding interest, where \(A\) is the CPI or price at the end of time period we’re concerned about, \(P\) the CPI or price at the beginning of the time period we’re concerned about, \(n\) is the number of times the rate is compounded each year, \(t\) is the number of years, and \(r\) is the rate that you want to solve for:
\[ A = P (1 + \frac{r}{n})^{nt} \]
If we assume interest is compounded once a year, \(n\) is 1 and can disappear. This simplifies to:
\[ \text{CPI}_{\text{new}} = \text{CPI}_{\text{old}}(1 + r)^{t} \]
We can rearrange the formula so that \(r\) is on the righthand side by dividing, exponentiating, logging, and subtracting:
\[ r = exp(\frac{ln(\frac{\text{CPI}_{\text{new}}}{\text{CPI}_{\text{old}}})}{t}) - 1 \]
Alternatively, instead of assuming annually compounding interest, we can also assume exponential growth (or continually compounding interest), which uses the following formula (again where \(A\), \(P\), \(r\), and \(t\) are the prices in the last year, prices in the first year, the rate, and the number of years:
\[ A = Pe^{rt} \]
Or
\[ \text{CPI}_{\text{new}} = \text{CPI}_{\text{old}}e^{rt} \]
We can again rearrange the formula so that \(r\) is on the righthand side:
\[ r = \frac{ln(\frac{\text{CPI}_{\text{new}}}{\text{CPI}_{\text{old}}})}{t} \]
Clearest and muddiest things
Go to this form and answer these three questions:
- What was the muddiest thing from class today? What are you still wondering about?
- What was the clearest thing from class today?
- What was the most exciting thing you learned?
I’ll compile the questions and send out answers after class.