The Firm
Materials for class on Thursday, October 3, 2019
Contents
Slides
Download the slides from today’s class.

Calculating Gini coefficients
You can see global inequality statistics at Wikipedia. There are several columns here—the World Bank and CIA both calculate Gini coefficients (multiplied by 100 to be on a 0–100 scale), and the R/P columns are the 90/10 ratios you calculated in Problem Set 1 (income held by top 10% compared to income held by bottom 10%).
Here’s an example of how to calculate Gini coefficients in Excel:
Instead of using calculus to find the area under Lorenz curve, we used this formula where \(x\) = income, \(y\) = cumulative proportion of the population, and \(\mu_x\) = mean of income:
\[ \text{Gini} = \frac{2}{\mu_x} \text{Cov}(x, y) \]
You can also do this in R with the ineq package:
library(ineq)

# List of incomes
incomes <- c(10000, 20000, 50000, 100000, 200000)

# Calculate Gini coefficient
gini_coef <- Gini(incomes)
gini_coef
## [1] 0.4842105# Plot Lorenz curve
plot(Lc(incomes), xlab = "Proportion of population", ylab = "Proportion of income")
text(x = 0.2, y = 0.8, labels = paste("Gini:", round(gini_coef, 3)))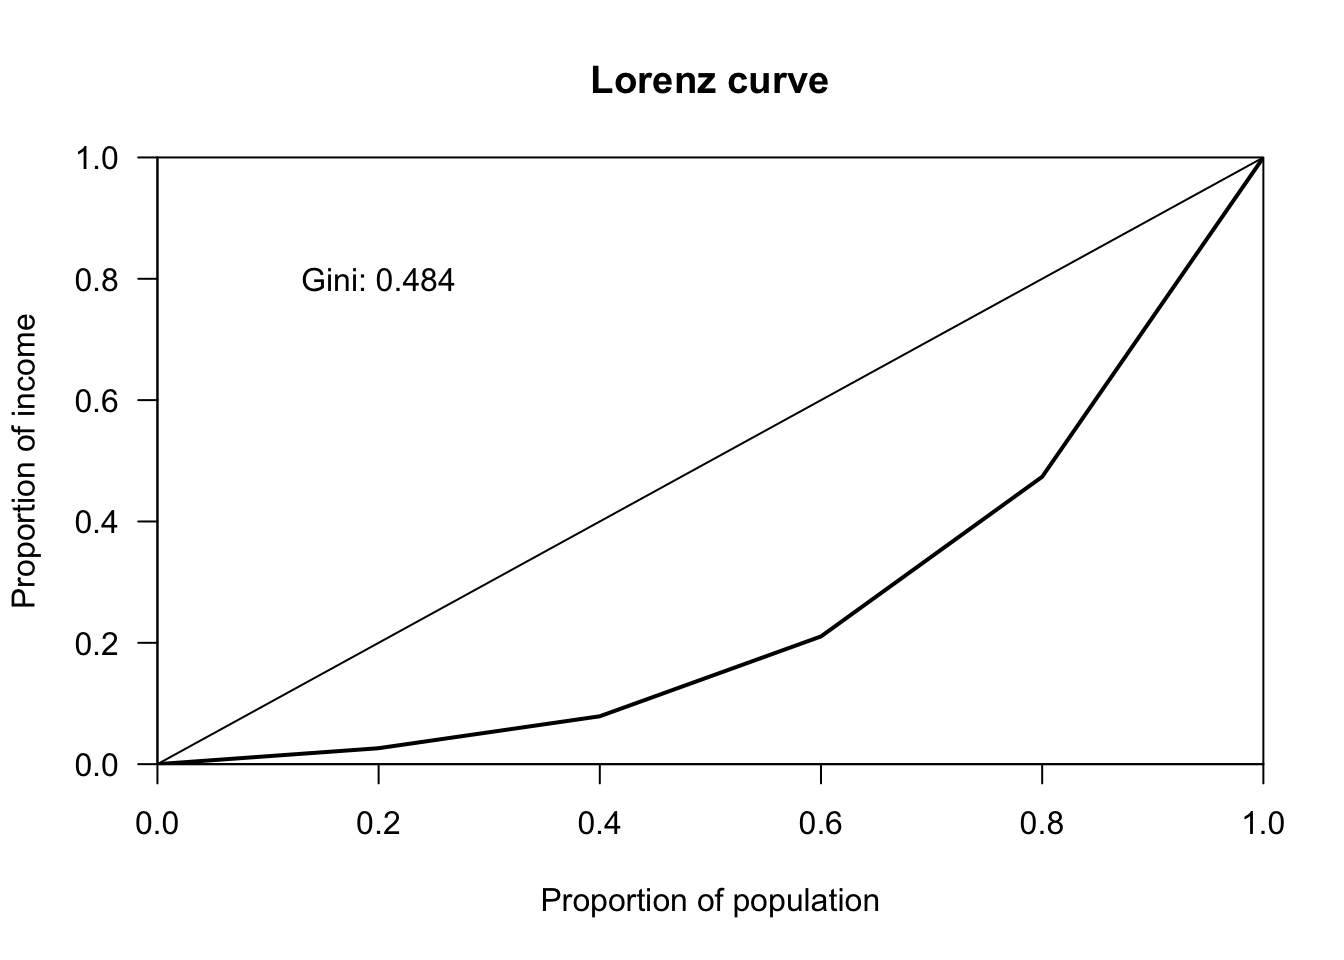
Clearest and muddiest things
Go to this form and answer these three questions:
- What was the muddiest thing from class today? What are you still wondering about?
- What was the clearest thing from class today?
- What was the most exciting thing you learned?
I’ll compile the questions and send out answers after class.