Evaluating policies
Materials for class on Thursday, November 21, 2019
Contents
Slides
Download the slides from today’s class.
Present value
\[ PV = \frac{FV}{(1 + r)^t} \]
Federal CBA components
Cost benefit analysis playground
Consider this example:
- GDOT is considering building a new freeway that is estimated to save 100,000 hours of driving and 5 lives each year.
- The project will require 1 million bags of asphalt ($100/bag) and 1 million hours of labor (half at $20/hour, half at $10/hour). The construction occurs in year 0.
- Starting in year 1, the freeway will require maintenance that will cost $18 million/year.
- Assume the following:
- Drivers estimate the value of their time at $17/hour
- The value of a statistical life is $5 million
- The costs and benefits of the project will last for 25 years
- The discount rate is 4%
Answer these questions:
What is the NPV of this project? What is the benefit-cost ratio?
Use an Excel data table and a graph to show the NPV across a range of the following values. At what point does the project break even?
- Discount rate
- Hours of driving saved
- Value of hour
- Lives saved
The VSL is a statistical estimate of the amount people would be willing to pay to reduce their risk of death by 1%, extrapolated out to 100%.
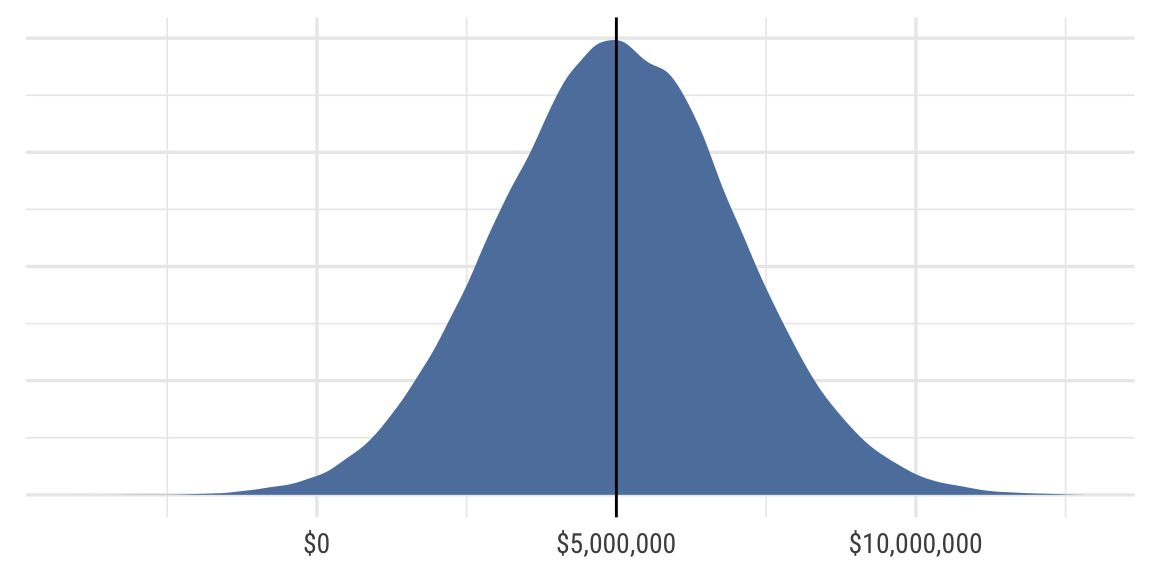
Because VSL is an average, it has measures of uncertainty associated with it. According to academic research, there is substantial uncertainty in VSL estimates: in 2008, the NHTSA reported that the 95% confidence interval for VSL ranges from $1,000,000 to $10,000,000, which represents a standard deviation of around $2,000,000. With a $5 million average, the distribution would look something like this:
Use Monte Carlo simulation in Excel to estimate the NPV over 1,000 trials, varying the VSL with a mean of $5 million and a standard deviation of $2 million. What is the average NPV over all these trials? What is the probability that the NPV is greater than $0? Is this still a good project, given the uncertainty of the VSL?
Clearest and muddiest things
Go to this form and answer these three questions:
- What was the muddiest thing from class today? What are you still wondering about?
- What was the clearest thing from class today?
- What was the most exciting thing you learned?
I’ll compile the questions and send out answers after class.