Problem set 6
Due by 11:59 PM on Monday, October 14, 2019
Submit this as a PDF on iCollege. You can use whatever you want to make your drawings, including Gravit Designer, Adobe Illustrator, Excel, PowerPoint, Microsoft Paint, or photographed/scanned pen and paper.
Cite your sources and show your work.
1
(This is similar to the Harvest Box/WIC example we talked about in class)
Suppose residents of a rural community in a developing nation spend all of their income on two goods: clothing and food. The price of clothing is 10 dinar per package and the price of food is 5 dinar per kilogram.
Consider a family with income of 200 dinar per week. In the absence of any government program, the family would consume 30 kg of food.
- Draw the family’s budget line, labeling all axes and all points whose value you know. Mark the family’s equilibrium consuption point as \(A\).
- On the same graph, draw a new budget line for a program that provides each family with 5 free packages of clothing.
- In a new graph, draw the family’s original budget line. Show the effect of an increase in the price of clothing to 20 dinar per package, assuming that clothing is a normal good. Show the income and substitution effects. Use actual numbers. (There are no correct numbers, though.)
- What do the income and substitution effects mean in this situation?
2
The distribution of incomes in Pawnee, Eagleton, and The Good Place follows the Lorenz curves plotted below, with the following Gini coefficients:
| City | Gini |
|---|---|
| Pawnee | 0.2549 |
| Eagleton | 0.6306 |
| The Good Place | 0.1105 |
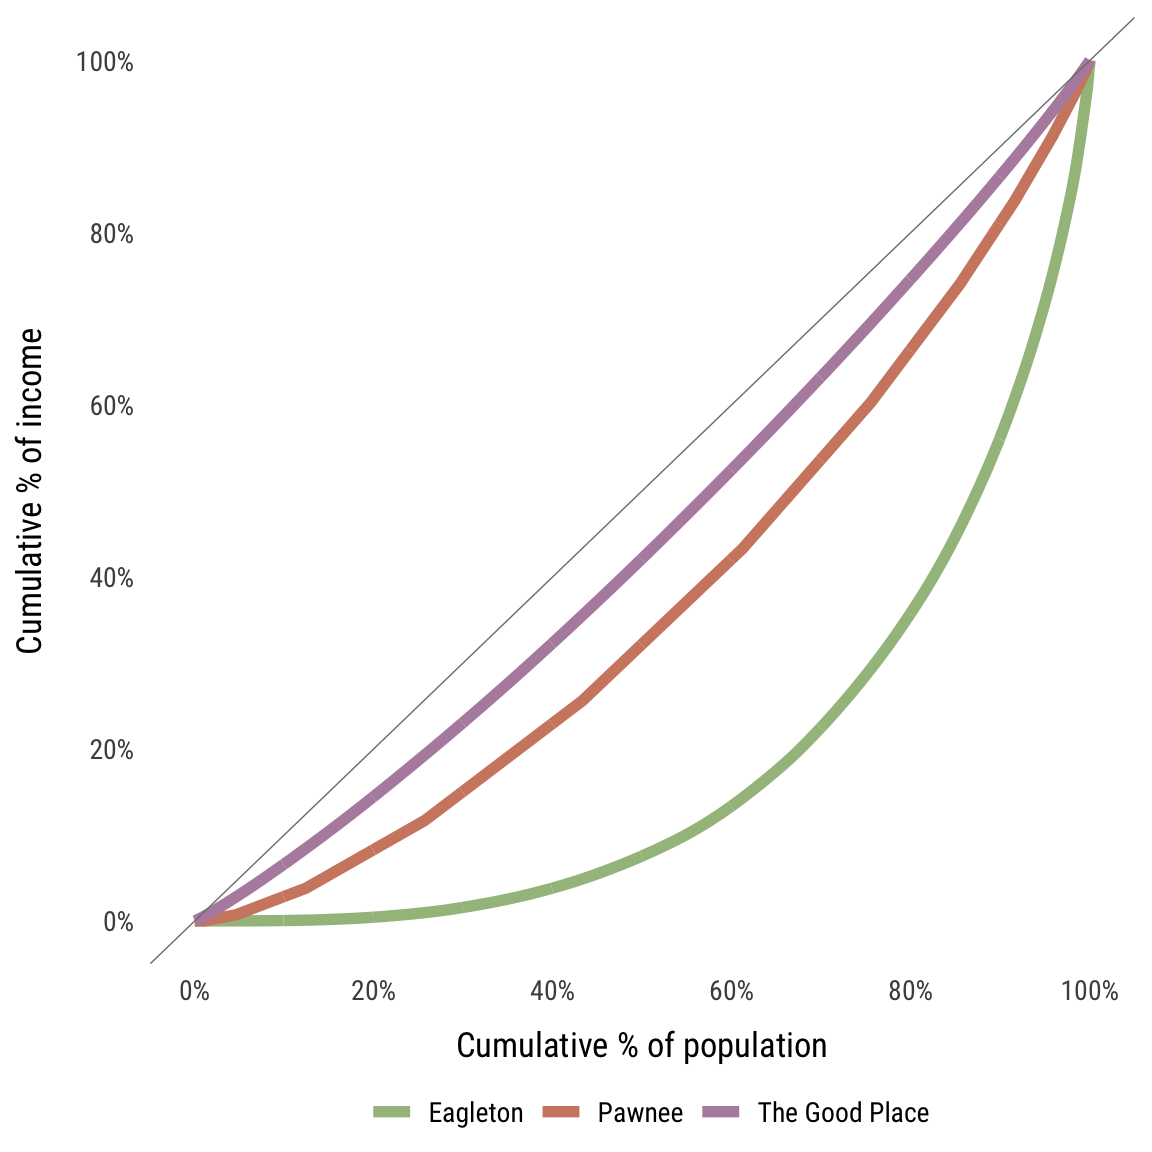
Which city has the most equally distributed income? Which has the least? How do you know? What are the possible implications of the income distributions in each of the cities? Discuss in ≈60 words
3
Think of two public or nonprofit sector jobs. In each case, describe why the employment contract is necessarily incomplete. What important parts of the person’s job—things that the employer would like to see the employee do or not do—cannot be covered in a contract, or if they are, cannot be enforced? Discuss in ≈75 words.
4
Consider the following income distribution in a 10-person society:
| Person | Income |
|---|---|
| 1 | $10,000 |
| 2 | $12,000 |
| 3 | $15,000 |
| 4 | $30,000 |
| 5 | $50,000 |
| 6 | $70,000 |
| 7 | $100,000 |
| 8 | $110,000 |
| 9 | $120,000 |
| 10 | $800,000 |
Draw the Lorenz curve for the society and calculate the Gini coefficient. What does this number mean?The Excel file from class 6 will be helpful here.
5
True or false: The substitution effect of a price change always goes in the opposite direction from the income effect. Explain with a graph and discuss in ≈30 words.
6
Consider an individual’s indifference curves for the consumption of two goods (things you would like to have more of). In this case, which of the following statements are true (only one is true)? Explain why each option is true or false in ≈20 words.The Marginal Revolution videos on indifference curves will be super helpful here.
- The indifference curves are downward-sloping.
- The indifference curves can sometimes cross.
- The indifference curves cannot have sections that are straight lines.
- The indifference curves cannot have kinks.
7
Leslie Knope, deputy director of the parks department, once mused “Why would anybody ever eat anything besides breakfast food?” Consistent with this belief, she consumes waffles whenever possible.
Here are 5 different sets of budget lines and indifference curves. In each, point A shows original consumption, point B shows new consumption after a change in budget, and point C shows the in-between level of hypothetical consumption. The red line shows the original budget line; the blue line shows the budget line after a change in prices.
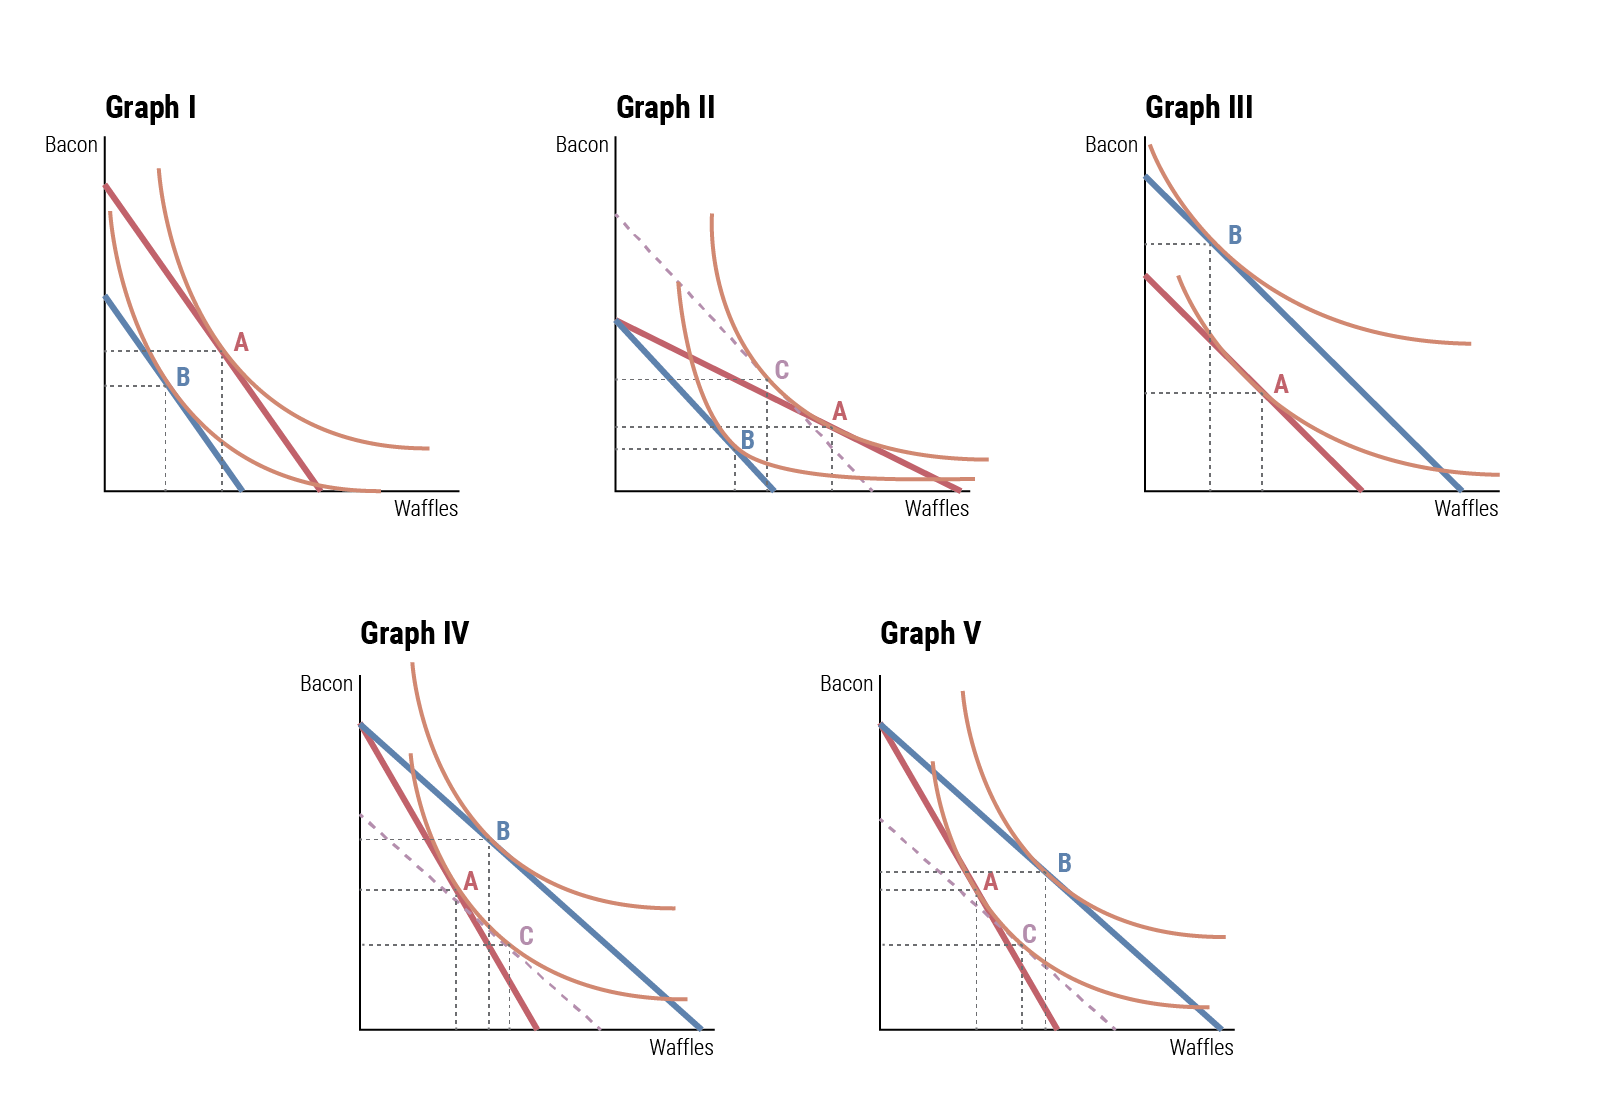
For each of these questions, select the appropriate answer(s) and explain why in ≈20 words.
Of these graphs, which one(s) show an increase in the price of waffles? (multiple answers allowed, but multiple answers aren’t necessarily correct)
- I
- II
- III
- IV
- V
Of these graphs, which one(s) show an increase in income? (multiple answers allowed, but multiple answers aren’t necessarily correct)
- I
- II
- III
- IV
- V
Which of these graphs show waffles as a normal good? (multiple answers allowed, but multiple answers aren’t necessarily correct)
- I
- II
- III
- IV
- V
Which of these graphs show waffles as an inferior good? (multiple answers allowed, but multiple answers aren’t necessarily correct)
- I
- II
- III
- IV
- V